PPC case study for Agora Discount: sales growth and ROAS in 450 days
PPC case study for Agora Discount: sales growth and ROAS in 450 days
How Agora Discount increased its turnover by about 85% and improved ROAS by about 35% in 450 days.
We will review the case of Agora Discount, an online store of goods for home, garden and repair. Using a comprehensive PPC strategy, the team increased sales by 85%, increased ROAS by 35% and reduced CPA by 4% in 450 days (January 20, 2025 to April 13, 2026). This case study analyzes the initial situation, step-by-step strategy, results and conclusions.
Niche: e-commerce, home, garden and repair equipment.
Geography: Ukraine.
Assortment: power tools, garden equipment, kitchen equipment, home appliances.
Competitors: large marketplaces (Rozetka, Prom, Epicenter) and niche stores.
Features: a wide range, different product categories, an emphasis on promotional offers and fast delivery.
Customer request
Agora Discount asked for the following tasks:
Increase sales and revenue from contextual advertising.
Scale ads without loss of efficiency.
Improve ROAS (return on advertising costs).
Decrease CPA (the cost of attracting conversions).
Scale Performance Max/shopping campaigns and select categories by their margins.
Starting situation
Before the project started, the account had a chaotic structure: one Performance Max campaign covered all categories, search campaigns were irrelevant, and analytics were superficial. On average, ROAS stayed at ≈33.7 (first 30 days) and CPA is ≈51.7 UAH. Conversions were unstable, and low-margin products prevailed, which made it impossible to scale the budget.
Key starting metrics (first 30 days)
Metric
Value
Revenue (conversion value)
≈1,819,077 ₴
Cost
≈55,949 ₴
Conversions
≈1,125
Average ROAS
33.7
Average CPA
51.7 ₴
CTR
3.0%
Conversion Rate (CR)
1.9%
Challenges:
Low and unstable ROAS.
Lack of detail by category (all products in one campaign).
Irrelevant search structure and shopping campaigns.
Poor analytics: goals were not tracked correctly, and there was no segmentation by product margins.
5. PPC strategy
1. Ad account audit
Verification of campaigns. We analyzed Performance Max, Search and Shopping campaigns: we identified mixed audiences, intersections of search queries and brand conversions.
Tracking check. We reconfigured Google Analytics 4 and GTM: we introduced e-commerce transactions and transferred margins as custom conversions.
Category analysis. We divided the goods into groups by margin (high, medium, low) to highlight priority ones.
Feed and product name analysis. We found that the names did not match popular searches; there were not enough product descriptions.
2. Restructuring campaigns
Performance Max by category. Instead of one campaign, several were created: separately for power tools, garden equipment, home appliances and promotional items. A separate budget was set for each one in accordance with the margin.
Search campaigns. We created a brand campaign, as well as general (non-brand) campaigns with exact matches and negative keywords.
Shopping campaigns. We optimized Google Shopping: separate feeds for products with different margin levels and for regions; we tested Smart Shopping and standard Shopping campaigns.
Promotional materials. We updated banners and responsive ads, added promotional elements, seasonal offers and personalization.
3. Working with the feed
Optimizing product names. We used templates with the brand name, key characteristics and category (for example, “Bosch 18 V cordless drill for home”).
Clean up the feed. Unprofitable and uncompetitive positions have been removed.
Working with margins. Rates and budgets were raised for high-margin categories; for low-margin categories, the minimum budget was left or excluded.
Add attributes. We added colors, sizes, seasonality and other attributes that increase relevance.
4. Optimizing budgets
Top category scaling. We gradually increased budgets for campaigns with high ROAS and good conversion rates.
Reducing unprofitable campaigns. We identified campaigns with CPA > 70 UAH and ROAS < 30 and reduced budgets for them or turned them off.
Redistribution of budgets. Part of the budget was redistributed to PMax and Shopping; less effective Search campaigns were reduced.
Using seasonality. During peak seasons (spring — gardening equipment, autumn — heaters, blackout — alternative food sources, etc.), budgets were increased, and in the off-season — reduced.
5. Analytics and optimization
E-commerce analytics. We collected data on income, average check, margin, conversions, and goods.
Attribution. We used data-driven attribution in Google Ads and GA4 to distribute conversions correctly.
Automated optimization. We set up scripts to track ROAS, CPA and seasonality indicators.
Testing rates. We compared manual betting management with automated strategies (maximize conversion value with target ROAS). They gradually abandoned manual control in favor of strategies with targeted ROAS.
6. Results
Metric
First 30 days
Last 30 days
Cost
≈55,949 ₴
≈75,560 ₴
Conversions
≈1,125
≈1,634
Revenue (conversion value)
≈1.82M ₴
≈3.37M ₴
Average CPA
51.7 ₴
49.7 ₴
Average ROAS
33.7
45.8
CTR
3.0%
4.0%
Conversion Rate (CR)
1.9%
2.1%
Changes:
Turnover increased by ≈85% (from 1.82 million ₴ to 3.37 million ₴).
The number of conversions increased by ≈45%.
ROAS increased from 33.7 to 45.8 (+35%).
CPA fell by ≈4% (from 51.7₴ to 49.7₴), despite the increase in the budget.
CTR increased by ≈33%, and the conversion rate is at ≈10%.
The number of impressions was almost unchanged (-3%), but the number of clicks increased by ≈29%, which indicates an increase in ad quality and targeting accuracy.
6.2 450-day cumulative results
Over the entire period (449 days in our file), the account has generated ≈51.26 million ₴ of turnoverby spending ≈1.45 million ₴. The total ROAS was ≈37, and the total number of conversions is ≈23,575.
Average CPA for the entire period — ≈65 ₴, average conversion rate — 2.28%.
6.3 Charts
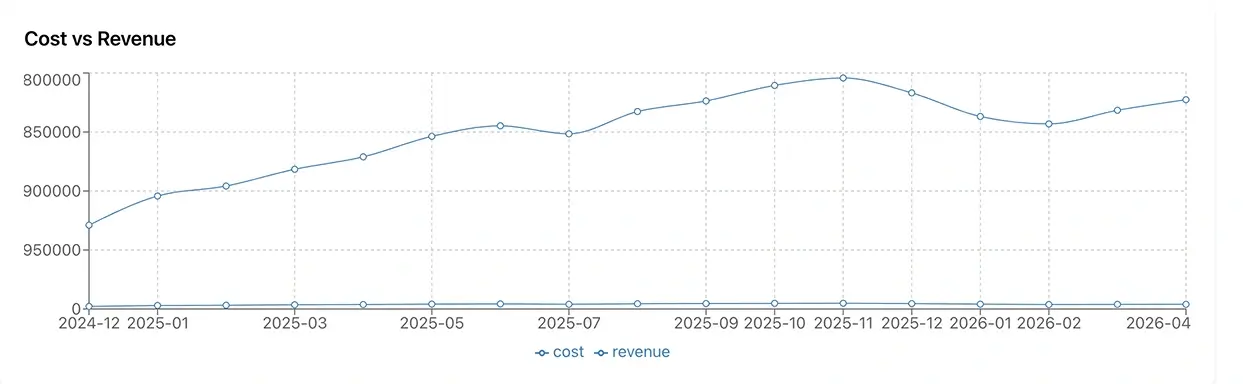
The graphs show the dynamics of key indicators. It can be seen that during 2025, expenses grew, but turnover increased faster, which ensured the growth of ROAS. In 2026, the budget was optimized, focusing on profitable categories, which made it possible to maintain a high return on investment.
Figure 1 — Cost and Conversion Value dynamics by month. The graph shows a significant increase in turnover since spring 2025 and peak seasons in autumn.
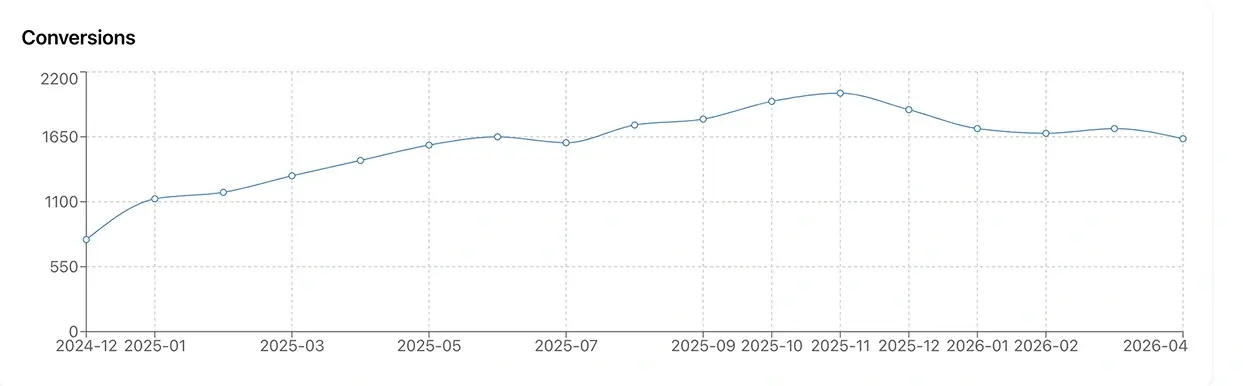
Figure 2 — number of conversions by month. The growth in traffic and the optimization of categories have led to a steady increase in the number of orders.
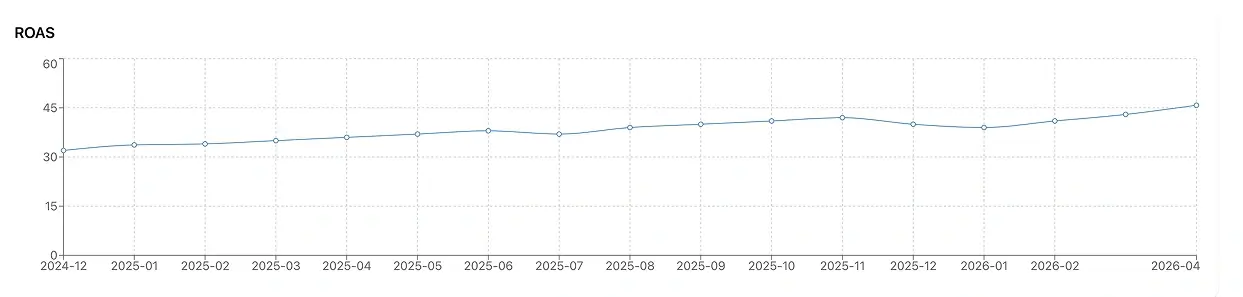
Figure 3 — average ROAS by month. After the introduction of segmentation and feed optimization, ROAS increased and stayed above 40 in most months.
7. findings
Structure is the basis for success. The division of the account into categories and margins made it possible to control budgets and test hypotheses separately.
Performance Max works when set up correctly. PMax campaigns segmented by category and high-quality creatives showed the highest ROAS.
Feed is the heart of e-commerce. Matching product names to search queries, adding attributes, and removing unprofitable items directly affected conversions and CPA.
Analytics decides. Proper tracking, margin transfer, and attribution made it possible to make informed decisions about budgets and rates.
Seasonality is important. During peak seasons, it is advisable to increase budgets, and during the low season, it is advisable to optimize costs and focus on profitable categories.
Scaling ≠ a chaotic increase in the budget. It was only thanks to structure and analytics that it was possible to increase expenses by 35%, while significantly increasing revenue.
Do you want to increase sales?
Submit a request, our head of analytics will contact you and show you how we will achieve results for your business
Thank you! Your submission has been received!
Oops! Something went wrong while submitting the form.
Looking for growth opportunities for your business?
Request a free audit — our expert will prepare a personalized action plan.
Your data is securely protected
Thank you for your submission! We will contact you soon.
Oops! Something went wrong while submitting the form.