Content



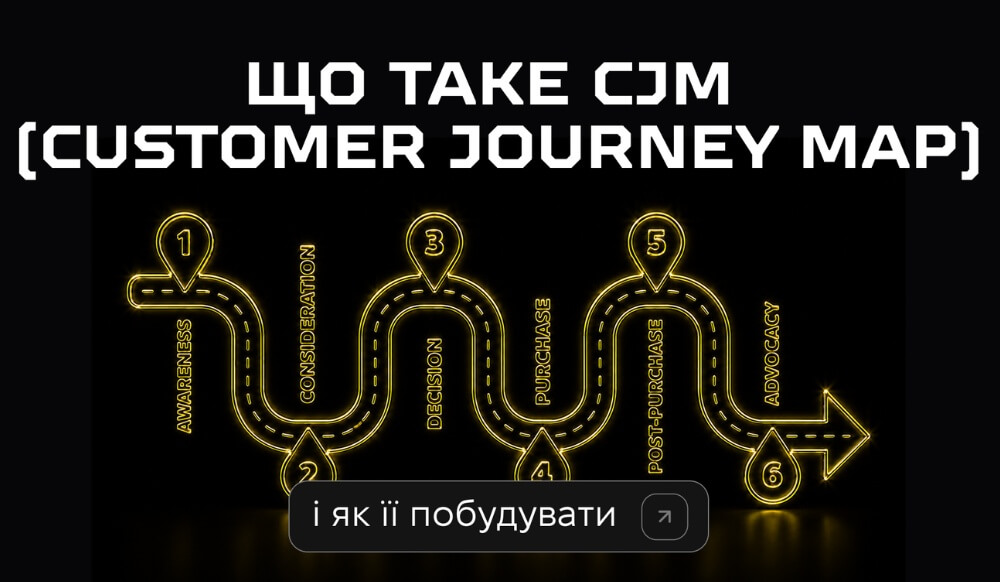
A person interacts with a brand long before making a purchase and continues to do so after placing an order. At every stage, they make decisions, encounter challenges, evaluate service, and form an impression of the company. This is why it is vital for a business to see the entire user journey, not just the moment of conversion. One of the most effective tools for this analysis is the Customer Journey Map.
A CJM is a visual diagram that shows a person's journey from their first encounter with a brand to the purchase and subsequent interaction. A Customer Journey Map is a way to look at the process through the customer's eyes, identifying their needs, expectations, and potential challenges. This is why a customer journey map helps identify growth opportunities and improve the user experience.
Customer Journey Maps (CJM) are used in marketing, sales, UX design, and customer service. They consolidate information about user behavior, interaction channels, emotions, and barriers at each stage. As a result, decisions are based on accurate data rather than intuition or assumptions.
To put it simply, a Customer Journey Map describes the route from the emergence of a need to a repeat purchase or brand recommendation. The company can see which touchpoints are working effectively and which ones need improvement. This makes it easier to determine which areas require priority attention.
Customer behavior is rarely limited to a single interaction with a website or an advertisement. A client may hesitate for a long time, returning to study reviews and compare options before making a decision. This is why a customer journey map helps evaluate the entire interaction process rather than just individual stages.
A CJM allows you to find the points where users most often leave the site, abandon a purchase, or encounter difficulties. Analysis reveals unnecessary steps, confusing navigation, weak pages, and a lack of information. Removing such barriers has a positive impact on business performance.
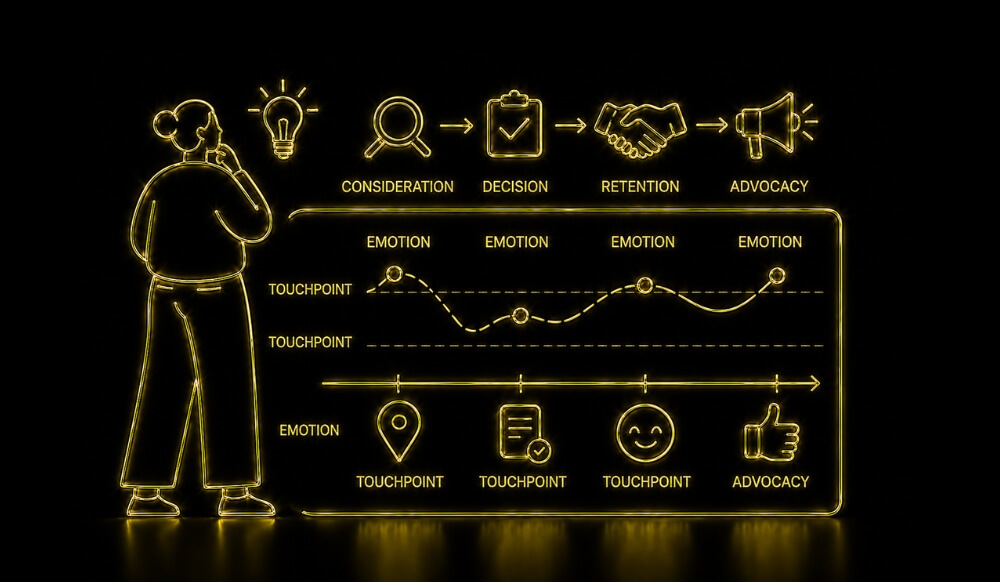
When a company understands its audience's motives, it is easier to improve service and simplify interactions. Systematic work with the map helps to quickly identify the reasons for churn, improve touchpoints, and encourage repeat purchases. This is why the Customer Journey Map is increasingly used as a foundation for optimizing marketing and user experience.
A high-quality diagram describes not only the stages of interaction but also the person's behavior, expectations, and emotions. The more accurately the data is collected, the more useful the conclusions will be. This is why CJMs are created based on analytics, research, and real user experience.
The first element is a description of the target audience. It includes information about a person's needs, goals, motivations, potential doubts, and behavioral patterns. A detailed profile helps build a customer journey map for a specific segment rather than an abstract user.
The diagram covers all of a person's contacts with the brand—from the first ad message to after-sales service. Interaction can take place via Google, social media, a website, phone, messenger, or email. Analyzing all touchpoints provides a complete picture of the interaction.
At every stage, it is essential to capture what the person is doing, what questions arise, and what emotions accompany the process. The emotional component often explains why a user abandons a purchase or, conversely, develops trust. This analysis helps to more accurately understand the audience's real experience.
After describing all the stages, you need to identify the factors that complicate the user journey. These could be technical errors, long forms, a lack of information, or a complex checkout process. Before analyzing, consider the following aspects:
A comprehensive analysis helps determine which changes will have the greatest impact and improve the user experience.

A practical CJM can be visualized as follows:
Such a table helps the team quickly see where doubts arise and which touchpoints require improvement.
Creating a customer journey map begins with gathering information and ends with implementing specific changes. It is important to work with real data, as it reflects the actual user experience. Regularly updating the map keeps it relevant as the business evolves.
The first stage involves analyzing web analytics, interviews, surveys, call recordings, CRM data, and other sources. It is useful to combine quantitative metrics with qualitative feedback. This approach reveals the actual behavior of the audience at different stages of interaction.
After gathering information, you need to create profiles for your main segments. For each persona, define their goals, motivations, needs, and potential challenges. This allows you to create individual interaction scenarios instead of a one-size-fits-all map.
At this stage, identify all points of interaction with the brand—from the first encounter to repeat purchases. It is important to include the website, Google search, advertising, social media, email, messaging apps, and customer support. This is how the customer journey map reflects the full picture of the user experience.
Once the journey is mapped, you need to identify how the user feels at each stage and what difficulties arise during their interaction. This helps uncover the reasons behind drop-offs, doubts, or delays in decision-making. Analyzing emotions complements quantitative metrics and provides a more precise way to pinpoint problem areas.
The final stage focuses on the changes that will have the greatest impact on the user experience. Before implementing solutions, consider analyzing the following areas:
After implementing changes, it is advisable to review the map again to evaluate their impact and identify new opportunities for growth.

An online store notices that many users view product pages but leave the site before paying. Analytics data, session recordings, and support tickets reveal the reason: shipping costs only appear at the final step. The team adds a shipping calculator to the product page and cart, then monitors the change in the order completion rate.
This example shows how a map turns scattered signals into a concrete hypothesis. Results should be evaluated through analytics rather than assumed to be guaranteed.
You can build a map in a simple spreadsheet, but specialized services make team collaboration easier. Miro, FigJam, Figma, Lucidchart, or Canvanizer are commonly used for visualization. It is convenient to combine analytical data with information from Google Analytics 4, CRM systems, surveys, and web analytics tools.
The choice of platform depends on the scale of the project, the number of participants, and data sources. Small teams often find an online whiteboard or spreadsheet sufficient, while large companies typically use integrated solutions. The most important thing is that the tool allows for quick updates and collaborative work on the map.
A CJM is not a one-time project. It should be reviewed after launching new products, changing the site structure, running advertising campaigns, or observing shifts in audience behavior. Regular updates help you identify new growth opportunities in a timely manner.
CJM helps you view brand interactions through the customer's eyes, identify barriers, and uncover opportunities to improve service. Systematic analysis of touchpoints supports conversion, loyalty, and a seamless user experience. The Locomotive Digital team helps you account for audience needs when developing strategy as part of our SEO service. This ensures that site structure and content are better aligned with search intent at every stage of the journey.
AI website audit
Enter your website address and get results instantly.

Request a free audit — our expert will prepare a personalized action plan.
Your data is securely protected